
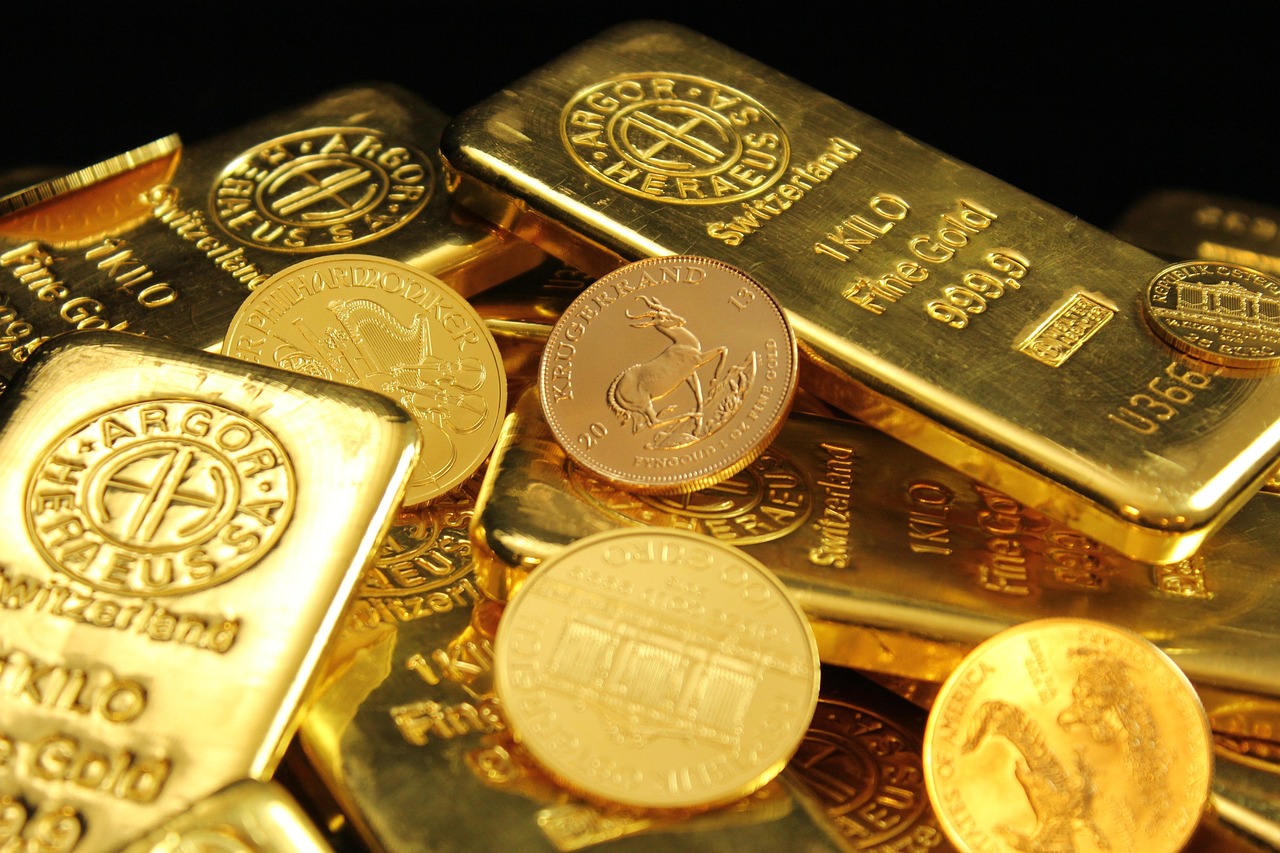
Gold briefly surged above $4,750 an ounce this week, its strongest level since mid-May, as falling bond yields, dollar weakness and renewed investment demand supercharged the precious metal’s rebound. But the rally ran directly into an overbought technical zone, and Wednesday delivered the warning bulls feared: spot gold slid more than 1% toward $4,595 after hotter-than-expected U.S. inflation data strengthened the dollar and revived Federal Reserve rate-hike expectations.
That leaves the price forecast at a crucial crossroads. Gold has broken back above its 200-day moving average and fundamental demand remains supported by central banks and investors, but a roughly 7% surge over several sessions pushed positioning into increasingly stretched territory. The battle now is between investors targeting $5,000 and traders betting the $4,750-$4,770 area will mark another major top.
Gold Price Forecast Changes Fast After $4,750 Breakout
Gold’s latest rally developed with remarkable speed. Spot prices traded around $4,516 on August 20 before jumping to $4,623.94 the following day, then reaching $4,680.70 on Monday before subsequently breaking above $4,750. The move was especially important technically because gold had reclaimed its 200-day moving average near $4,513, a level that had become a major reference point after the correction from the record highs reached earlier in 2026.
Once bullion moved decisively above that longer-term average, momentum buying accelerated. Gold gained more than 5% during the week through August 21, including its strongest single-day advance since February, as traders increasingly treated the move as a genuine technical breakout rather than a temporary bounce.
The problem is that fast rallies can become vulnerable just as quickly. The surge pushed gold into an overbought zone and brought prices toward a major resistance region around $4,770. Saxo Bank commodity strategist Ole Hansen identified that area as roughly the 50% retracement of gold’s January-to-June decline and a zone associated with previous May highs, making the latest reversal particularly important.
Related articles





Hotter Inflation Gives Bulls Their First Real Test
Wednesday supplied the first major challenge to the breakout. Spot gold fell about 1.3% to $4,594.84 an ounce, while U.S. gold futures declined around 0.9% to $4,650.90 after U.S. inflation data came in slightly firmer than economists expected.
The Personal Consumption Expenditures price index rose 3.7% year over year in July, above the 3.6% consensus forecast. Markets responded by modestly increasing expectations for another Federal Reserve rate hike, while the dollar strengthened and Treasury yields moved in a direction that reduced gold’s appeal.
That relationship is central to the trade. Gold produces no interest income, so higher expected rates increase the opportunity cost of holding bullion, while a stronger dollar makes dollar-denominated gold more expensive for many overseas buyers. The rally into $4,750 had benefited from almost exactly the opposite conditions: softer yields, a weaker dollar and expectations that monetary conditions would become more supportive.
The question now is whether Wednesday’s decline represents routine profit-taking after an overextended rally or the beginning of another meaningful correction.
Why Gold Suddenly Rallied So Hard
The move toward $4,750 was not driven by one catalyst alone. One important factor was the U.S. Treasury’s decision to expand long-term bond buybacks, which helped push yields lower while reigniting debate about U.S. fiscal sustainability and the long-term purchasing power of the dollar.
That combination can be particularly supportive for gold. Lower yields reduce the disadvantage of owning a non-yielding asset, while concerns about government debt and currency debasement encourage some investors to increase exposure to perceived stores of value.
Financial demand also strengthened noticeably. Gold call-option buying increased during the rally, while gold-backed funds recently attracted approximately 46.7 metric tons worth around $6.4 billion, their strongest inflow in roughly 10 months. That matters because ETF demand can add significant buying pressure when institutional sentiment turns bullish, particularly when momentum traders are already chasing a breakout.
Central Banks Still Provide a Powerful Long-Term Floor
The structural bull case does not depend entirely on speculative demand. Central banks remain major buyers and continue to provide one of the strongest fundamental supports beneath the gold market.
According to the World Gold Council, central banks and other official institutions purchased a net 289 metric tons of gold during the second quarter of 2026, up 62% from 178 tons in the same quarter a year earlier and roughly five times the revised first-quarter level. Poland remained a major buyer, while China increased the pace of reported accumulation.
The World Gold Council expects official-sector demand to remain significant through the remainder of 2026, even if total purchases finish below 2025 levels. That persistent demand matters because reserve managers have increasingly sought diversification across currencies and assets amid geopolitical uncertainty, sanctions risk and concerns surrounding government debt.
For gold bulls, this means deeper corrections may continue attracting buyers even when short-term speculative positioning becomes overheated.
High Prices Are Starting to Hurt Physical Demand
The bullish central-bank story is only part of the picture. The World Gold Council’s latest demand data showed a much more mixed market underneath the headline price strength.
Total gold demand including over-the-counter activity was essentially unchanged year over year at 1,269 tons during Q2. Gold-backed ETFs experienced approximately 45 tons of net outflows during the quarter, while total investment demand excluding OTC activity fell to 262 tons.
High prices are also damaging traditional consumption. Jewellery demand fell to approximately 278 tons, down 17% from a year earlier, as record bullion prices made purchases increasingly unaffordable for consumers.
That creates an important tension in the gold price forecast. Financial investors and central banks can continue driving prices higher, but the further gold rises, the more pressure appears in price-sensitive physical markets. For the move toward $5,000 to become sustainable, renewed institutional and ETF demand may need to compensate for weakening jewellery and retail demand.
Is Gold Overbought?
Technically, gold has clearly become stretched on shorter-term indicators following the surge toward $4,750. That does not automatically mean prices must fall, because strong momentum markets can remain overbought for weeks, but it does alter the risk-reward equation for investors buying after a near-vertical move.
After such a sharp advance, traders become far more vulnerable to profit-taking whenever a negative catalyst appears. Wednesday’s inflation surprise provided exactly that catalyst and showed how quickly the market can reverse when positioning becomes crowded.
The key technical zones are now unusually clear. Resistance sits around $4,750-$4,770, while the recently reclaimed 200-day moving average around $4,500-$4,520 represents an important support area. Another support zone sits near $4,410.
A decisive move back above $4,750-$4,770 would indicate that buyers have absorbed the latest pullback and could reopen the path toward $4,900 and eventually $5,000. A sustained break below the 200-day moving average would significantly weaken that bullish setup.
Could Gold Really Reach $5,000?
A $5,000 price is no longer treated as an extreme scenario on Wall Street. Morgan Stanley has said gold could move above $5,000 during 2027 under supportive monetary conditions, while other analysts continue to see long-term upside if real yields weaken and investment demand strengthens.
Even relatively cautious forecasts leave gold close to current levels. HSBC cut its 2026 average gold forecast in July to $4,560 an ounce, citing a more hawkish Federal Reserve outlook and stronger-dollar expectations, but still forecast gold ending 2026 at $4,750 and reaching $5,025 by the end of 2027.
That highlights the market’s unusual position. Gold can be technically overbought around $4,750 while still retaining a fundamentally bullish multi-year investment case.
Time horizon matters. A trader buying after a rapid 7% rally faces very different risks from a long-term investor expecting central-bank purchases, fiscal concerns, currency diversification and potentially lower real yields to support bullion over several years.
Jackson Hole Becomes the Next Major Catalyst
The next major catalyst is Federal Reserve Chair Kevin Warsh’s Jackson Hole address. Investors will be searching for clues about how the Fed intends to balance persistent inflation against softer economic momentum, and Wednesday’s PCE report has already made that policy debate more important.
A hawkish message would likely support the dollar and Treasury yields, creating additional pressure on bullion and potentially sending gold back toward the $4,500-$4,520 region. A softer message, particularly one suggesting the Fed can tolerate somewhat elevated inflation without tightening aggressively, could reverse Wednesday’s decline and quickly bring $4,750 back into view.
Gold therefore remains exceptionally sensitive to changes in monetary-policy expectations. The next large move may depend less on physical supply and demand than on how investors price real interest rates and the dollar over the coming months.
Price Forecast: The Levels That Matter Now
The immediate resistance zone sits around $4,750-$4,770. A decisive close above that range would represent an important technical breakout and could encourage momentum traders to target $4,900 before the psychologically important $5,000 level.
On the downside, the $4,500-$4,520 region is critical because it roughly corresponds with the recently reclaimed 200-day moving average. Below that, approximately $4,410 becomes the next notable technical support area.
Wednesday’s slide toward $4,595 means gold has already surrendered a meaningful portion of its latest breakout. The next several sessions should reveal whether investors view that retreat as a buying opportunity or whether the surge above $4,750 was an exhaustion move after an already extraordinary run.
Outlook: Gold Bulls Face Their First Serious Test
The gold price forecast remains structurally bullish but tactically dangerous. Central-bank demand remains powerful, ETF inflows have recently returned, fiscal concerns continue supporting the debasement trade and it has reclaimed important longer-term technical levels.
At the same time, the latest rally became stretched, physical demand is weakening under the weight of high prices and Wednesday’s inflation data reminded investors that the Federal Reserve can still disrupt the bullish trade through higher rates and a stronger dollar.
The immediate battle line is unusually straightforward: $4,750-$4,770 above and roughly $4,500-$4,520 below. A successful breakout through resistance could quickly turn $5,000 into the market’s next major target.
If the 200-day moving average fails, however, investors may discover that it’s spectacular move above $4,750 was not the beginning of the next leg higher — but the warning that the rally had finally gone too far.